Forex RSI Strategy Explained With Examples

Forex RSI Strategy Explained With Examples

Forex RSI Strategy Introduction:
What is RSI?
RSI is the short version of Relative Strength Index. It is a momentum oscillator that measures how quickly and how much the prices of things are changing. This indicator was developed by Welles Wilder, who also developed other famous indicators like Parabolic SAR and Average Directional Index.
Now that you know a little bit about RSI, I’m going to share with you 2 methods for using it effectively. This short blog post will help you understand and learn how to use RSI effectively.
Here is some basic information about RSI that you should know:
Trend
You can find the trend by knowing how the RSI line moves.
• The middle line on the RSI window is 50.
• If the RSI line is above 50, it means the trend is up.
• If the RSI line is below 50, it means the trend is down.
• However, this is not the most important thing you need to know.
The Forex RSI Strategy Method:
Forex RSI Strategy Method 1: Divergence
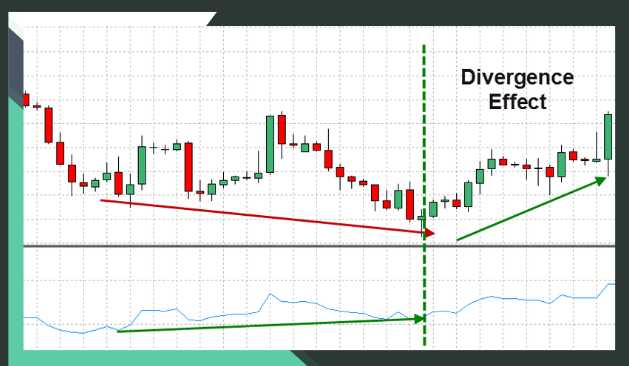
RSI can also be used to find divergence signals. Divergence happens when the price of the market is not aligned with the RSI direction.

For example, the EUR/USD price is going up while RSI is going down. This means that the market is not following the trend, which is called divergence. In this case, it’s called a buy divergence. Divergence can be used to find accurate and early reversal signals.
Buy Signal:
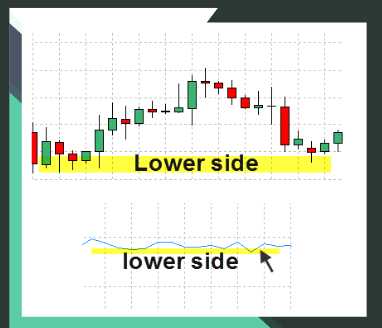
Lower Side of price and RSI
The buy/positive divergence happens when the price is lower than usual and the RSI is higher than usual.
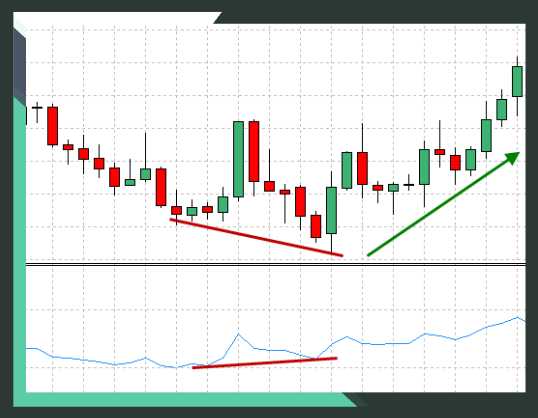
RSI divergence in action: Example 1
Example 2
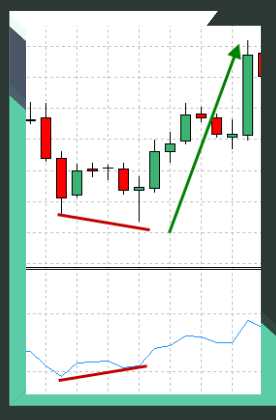
Example 3:
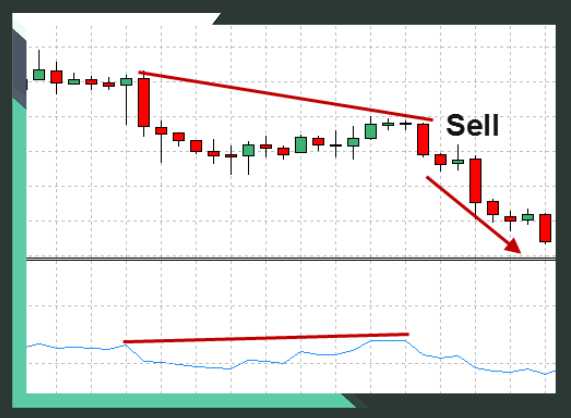
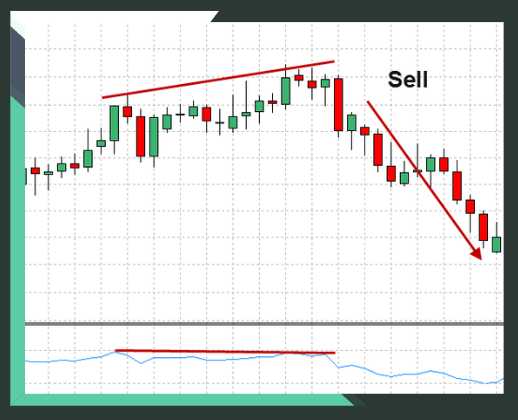
Sell Signal:

The sell/negative divergence happens when the RSI is on the upper side and the price is going down. You can see this happen in these images:
Example 1

Example 2
Example 3:
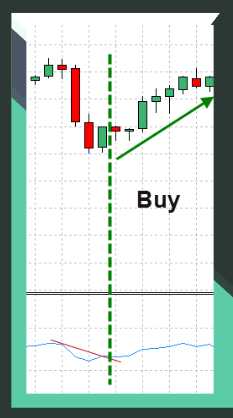
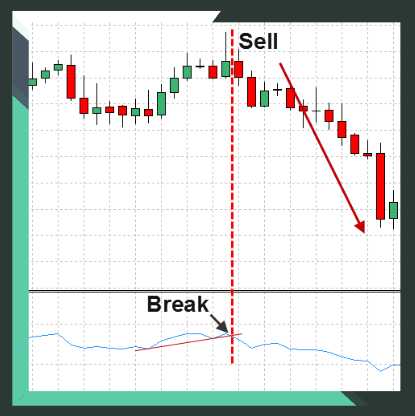
Forex RSI Strategy Method 2: RSI Trend lines breakout
We can also use trend lines on the RSI to identify when a trend is ending.
Buy signal: Enter on the next candle after the break of the trend line on RSI.
Example:
When you see the trend line on the RSI break, it’s time to sell. Enter your trade on the next candle.
Example 1:

Example 2:
The Forex RSI Strategy Method In A Nutshell:
Here is a basic overview of what you will need to do when using these methods:
1. Method 1: When the market is going up, you can sell your securities when there’s an upper divergence. When the market is going down, you can buy securities when there’s a lower divergence.
2. Method 2: You can use trendline breakout to determine when the market has changed directions.
***Tip: To increase the accuracy of your predictions, use candlestick patterns in combination with these methods.
I hope you found this blog post helpful. It detailed an easy way to dominate RSI. I wish you the best of success in your trading! If you found it useful, please share it with others.